Friday, January 17, 2014

PDF to animated GIF

In order to illustrate how fragmentation occurs, I created a PDF document (Fragmentierung.pdf) with one page for each step of the fragmentation.


 This is how I converted it to an animated GIF. The first step was to create a series of PPM files, one file for each page. The option -r 384 sets the resolution to 384 dpi. This somewhat odd resolution is four times 96 dpi which in turn is the resolution of the PDF being converted.


The pdftoppm command generates files that are numbered.


The files resulting from this conversation are huge in both display and storage size so the next step is to rescale them to a reasonable resolution. My choice was a width of 800 times 600. the for loop iterates over all PPM files, the output of the pamscale command sent to a file with a name based on the original file name using the shell's own capability to process strings. Finally, the --filter option controls how precisely the original high-resolution image is mapped to the low resolution one.

Let's assume the original file name is Fragmentierung-1.ppm. Then ${i%.ppm} yields Fragmentierung-1 and ${i%.ppm}_new.ppm results in Fragmentierung-1_new.ppm.


The result of this command - which on my old machine requires a considerable amount of time - is a new series of files that are considerably smaller than the original ones.


As the old files are no longer needed, I replace them with the corresponding new ones.


Now we have ppm files of the right size that are simply numbered.


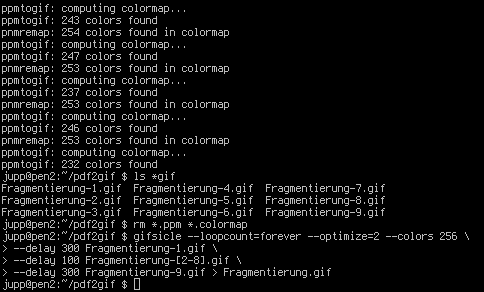
The PPM files usually have more than 256 colors (which is the maximum for GIFs). For this reason I use pnmcolormap to generate colormaps for the individual files that have no more than 256 colors.


This command results in tons of diagnostics output created by pnmcolormap.


The next command performs two tasks at the same time: pnmremap uses the colormap to map the original colors to no more than 256 with the -fs option making sure that Floyd-Steinberg dithering is used. Then the output converted to GIF formatusing ppmtogif and is written to a file with the file name extension .gif.


In this case both commands are a bit chatty so you again get lots of output.


Now we are almost done as we have a set of GIF files.


Just discard all the intermediary files. The next command looks complicated like hell but it isn't. gifsicle generates an animated GIF from a number of input files that need to be in GIF format.

  • --loopcount=forever makes the animation loop forever (i.e. after displaying the last frame of the animation it always restarts with the first one)
  • --optimize=2 optimizes the generated file as much as possible (without this option the file gets even bigger)
  • --colors=256 makes sure that the generated file has no more than 256 colors. This may seem superflous as each input file already has no more than 256 colors but the colors may happen to be different so that the overall number can be larger than 256.

The most important part of the command is the --delay options. If you provide this option, it applies to each image that follows up to the next command. Hence, in this case the first delay of 3 seconds applies to Fragmentierung-1.gif only, the delay of 1 seconds to Fragmentierung-2.gif through Fragmentierung-8.gif and the second delay of 3 seconds to Fragmentierung-9.gif.


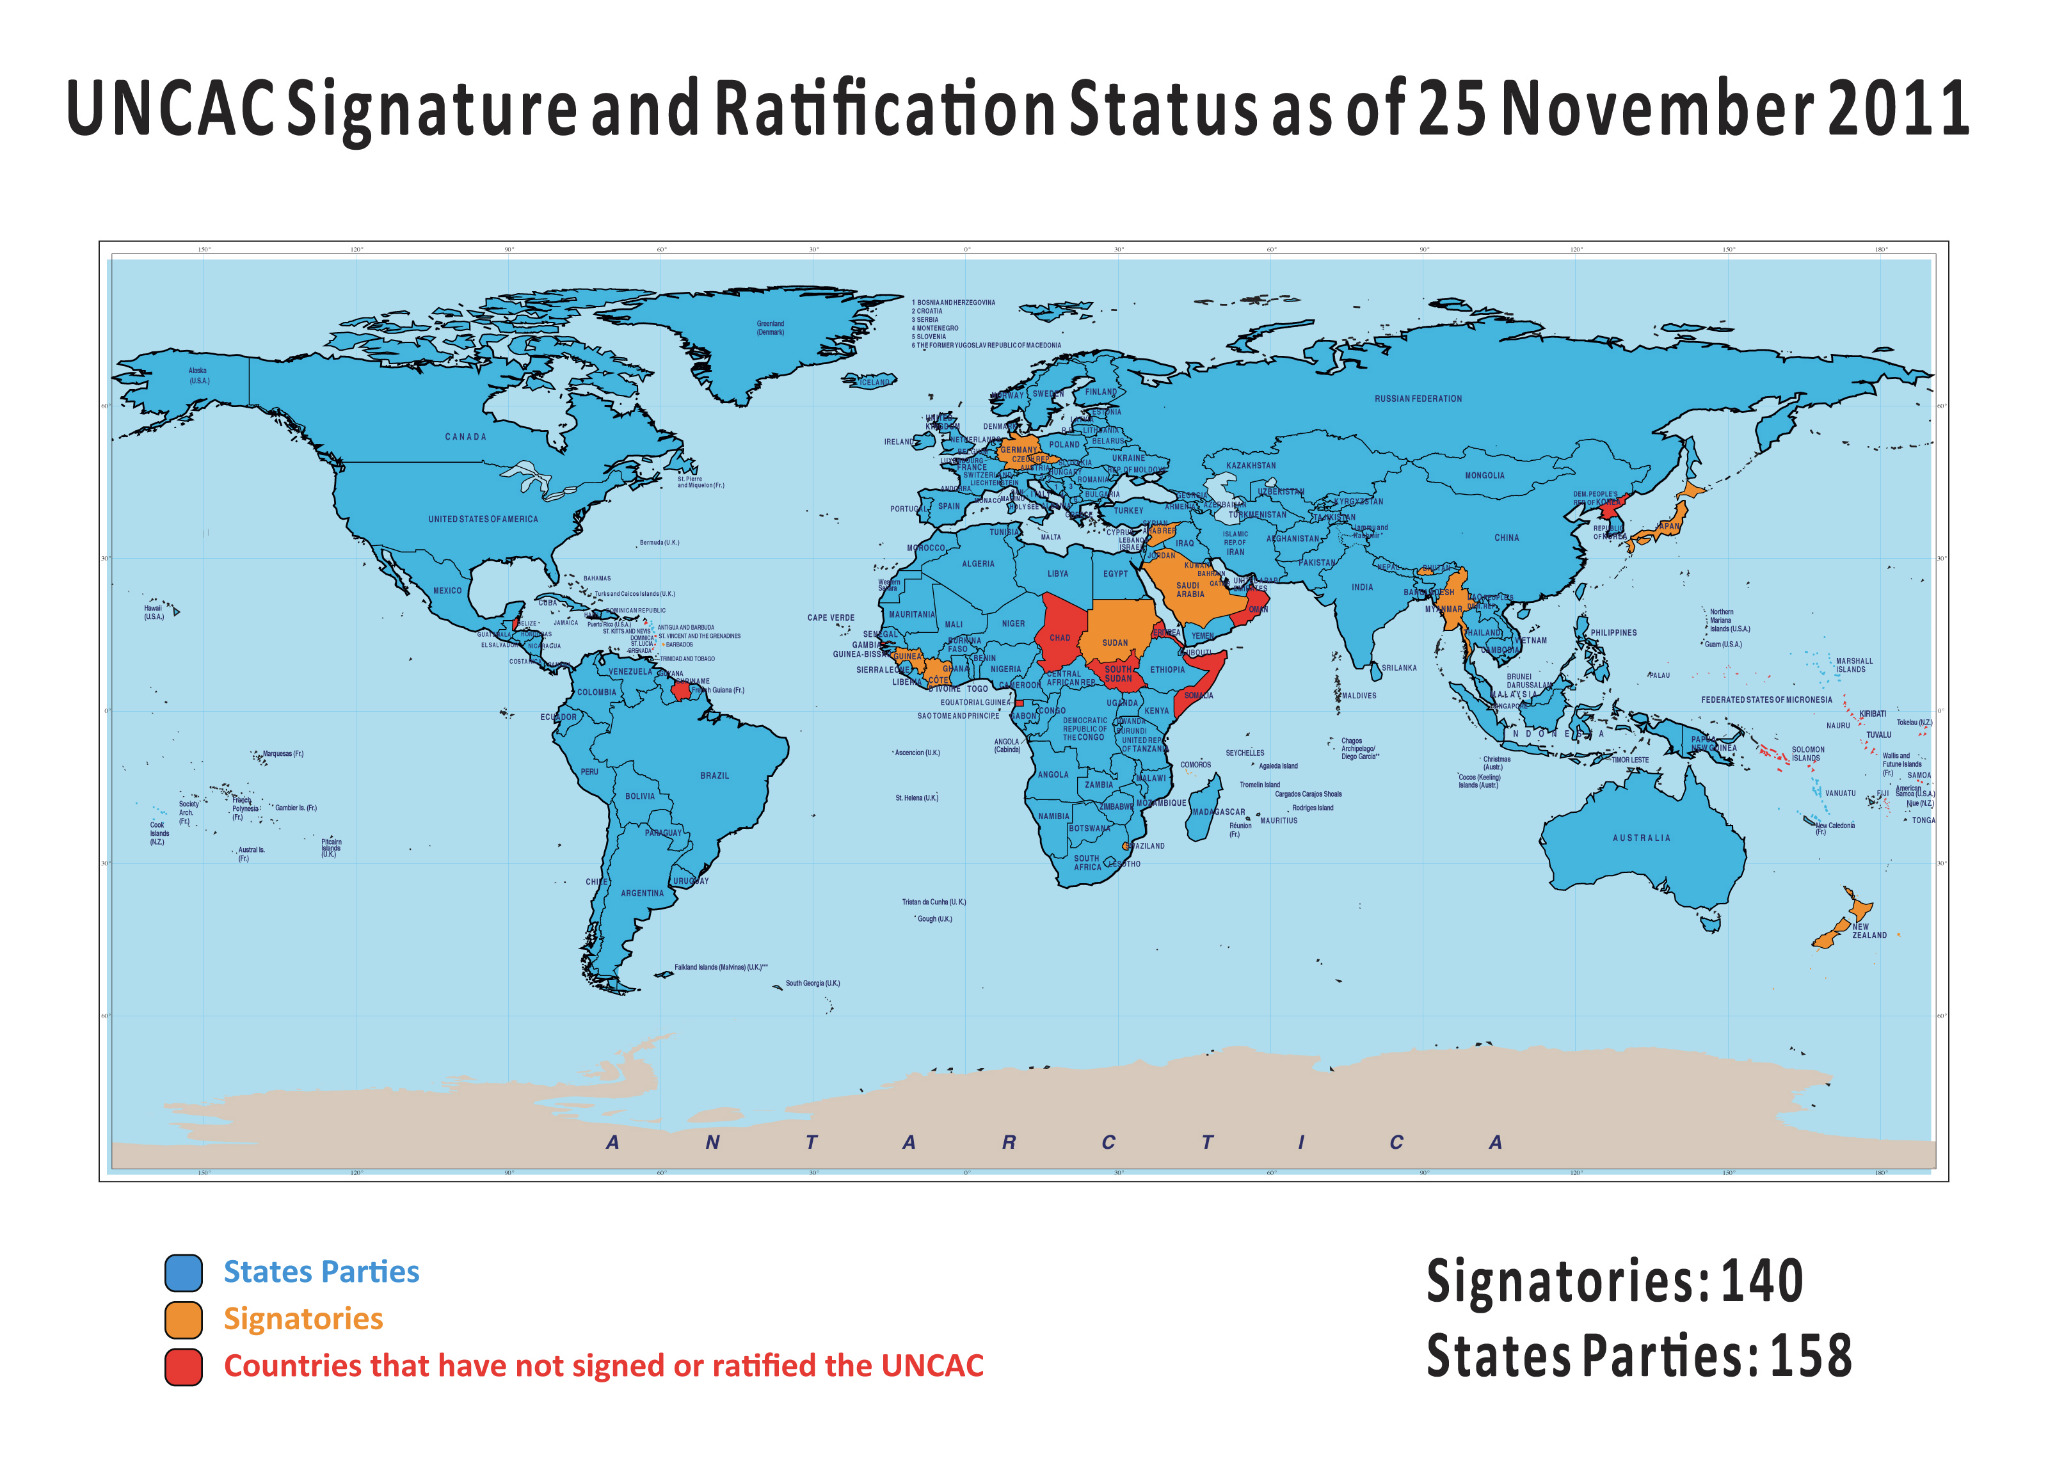
Finally done. Here is the animated gif that results from this effort.

Friday, November 29, 2013

Katyusha (Катюша)

I am a huge fan of Igor Presnyakov and what he does to/with his acoustic guitar.

Hear him perform the Russian song Katyusha (Катюша)


Monday, September 24, 2012

Distances from Bonn

I came up with the strange idea of sorting European capitals by how far they are from the town I live in (Bonn, Germany) and found that half a dozen of foreign capitals are nearer than the capital of Germany.

City Country Distance in km
Luxembourg City Luxembourg 142
City of Brussels Belgium 195
Amsterdam Netherlands 234
Paris France 400
Bern Switzerland 425
Vaduz Liechtenstein 437
Berlin Germany 478
London United Kingdom 510
Prague Czech Republic 527
Copenhagen Denmark 659
Vienna Austria 726
Ljubljana Slovenia 755
Bratislava Slovakia 779
Monaco Monaco 779
City of San Marino San Marino 857
Zagreb Croatia 857
Budapest Hungary 942
Dublin Republic of Ireland 957
Warsaw Poland 976
Oslo Norway 1047
Rome Italy 1065
Vatican City Vatican City 1065
Sarajevo Bosnia and Herzegovina 1143
Stockholm Sweden 1181
Belgrade Serbia 1195
Vilnius Lithuania 1300
Riga Latvia 1308
Podgorica Montenegro 1347
Madrid Spain 1421
Minsk Belarus 1430
Tirana Albania 1432
Ankara Turkey 1447
Skopje Macedonia 1463
Tallinn Estonia 1474
Sofia Bulgaria 1522
Helsinki Finland 1530
Bucharest Romania 1583
Chişinău Moldova 1639
Kiev Ukraine 1648
Valletta Malta 1745
Lisbon Portugal 1845
Athens Greece 1931
Moscow Russia 2086
Reykjavík Iceland 2257
Tbilisi Georgia 3034
Yerevan Armenia 3106
Baku Azerbaijan 3469

If you find this idea interesting what about composing a similar table for the location you live in?

Wednesday, September 19, 2012

Obtaining Tweeted Images in Original Size

An increasing number of tweets contains images uploded to twitter. Here is one example:
A particular example

I assume that you know how to find out URLs of images that are used on a web page.

The URL of the image you see in the tweet is https://pbs.twimg.com/media/A0BRGqGCcAEBdHW.jpg with the dimensions 600px × 428px (scaled to 435px × 310px).

If you click on the image to obtain a larger version you are presented with https://pbs.twimg.com/media/A0BRGqGCcAEBdHW.jpg:large with the dimensions 1,024px × 730px. This still isn't the original image.

I then made a well-educated guess and tried
https://pbs.twimg.com/media/A0BRGqGCcAEBdHW.jpg:orig and it actually worked; I got the original size image with dimensions 2,048px × 1,460px.

So all you need to do to obtain an original size image is to append »:orig« to the URL of the small version of the image.

Note that this only works for images uploaded to twitter not for images hosted on flickr.

Here is one example: https://twitter.com/VirtualAstro/status/241683461155475456 shows a nice photo of a blue moon; the 3 MP image can be found at https://pbs.twimg.com/media/A1qS3JvCQAE0QPv.jpg:orig

Sunday, September 2, 2012

Polar Sea Ice Page Updated

I had to update the Polar Sea Ice page because it referred to the record ice extent as data of 2007 while in reality the record extents (minimum in the Arctic, maximum in the Antarctic) are currently being updated every day (as of writing this on 2012-09-02).

I originally did not expect this to become necessary so soon. The reason for this misjudgement of mine is the Atlantic Multi-decadal Oscillation. Back in 2008 I learned that it should currently be counteracting the effect of global warming on the Arctic region.

A BBC article of 2008-05-01 puts it like that:
The Earth's temperature may stay roughly the same for a decade, as natural climate cycles enter a cooling phase … A new computer model … suggests the cooling will counter greenhouse warming. However, temperatures will again be rising quickly by about 2020 …
In contrast, a recent BBC article (2012-08-27) has this to say:
A recent paper from Reading University … [estimated] that between 5-30% of the recent ice loss was due to Atlantic Multi-decadal Oscillation - a natural climate cycle repeating every 65-80 years. It's been in warm phase since the mid 1970s.
Allow me to call this difference in description a little strange.

NASA: Arctic sea ice reaches record low

Tuesday, March 6, 2012

Asteroids Missing Earth: What Means “Close Call”?

Every now and then you read about asteroids passing Earth in a certain distance but nobody gives you a feeling of how close such an encounter is. Allow me to fill in this gap.

Say an asteroid passes in a distance x from Earth, the radius of which we will call r. We now can ask how likely it is that an object that hits a disk of radius r+x also hits a disk of radius r provided that it any point on the larger disk is hit with equal likelihood.

The likelihood then is p = A(r)/A(r+x) where A is the area of a disk of the given radius, In other words p = πr²/π(r+x)² = 1/(1+x/r)². If we now define ξ=x/r (which is the distance in units of Earth's radius we get a quite simple formula: p = 1/(1+ξ)².

Using ξ is advantageous as it is a value you actually find in tables. Let’s try a couple of values; LD means Lunar distance and is the distance in terms of the average distance between Earth and Moon:

Distance inξp in %
LDkm
1.65614636619.77100 0.098
0.49684190985.93 30 0.104
0.16561 63661.98 10 0.826
0.04968 19098.59  3 6.250
0.01656  6366.20  125.000
0.00497  1909.86  0.359.172
0.00166   636.62  0.182.645
0.00050   190.99  0.0394.260
0.00017    63.66  0.0198.030

Please note that the closer an encounter is the less meaningless this rough estimate becomes as the asteroid by no means randomly hits the disk of radius r+x but follows a clearly determined path.

Sunday, March 4, 2012

Termtter, a terminal-based Twitter client

Termtter is a terminal-based Twitter client written in Ruby that can be installed as a Ruby gem. In the easiest case you simply type in
gem install termtter
and you are done with installing the program, otherwise see How to Install.

Once termtter has been installed you can simply  run it provided that you do not need to use a proxy; in that case see Configuration. However, like any other Twitter application, termtter needs to be authorised in order to function properly.

Therefore, at the initial run, termtter will provide you with an authorisation URL.

First launch of termtter

Once you visit this URL, you will be asked whether you want to authorise termtter to use your Twitter account.

Visiting authorization URL

If you choose to authorise the application (i.e. termtter) you will provided with a PIN.

Obtaining PIN

After having obtained the PIN you need to enter it in termtter. Copy and paste will not work because the PIN is shown as an image.

Entering PIN

Now that termtter has been authorised you can use it at your liking.

Termtter at work